
Incrementality Test: Measuring Online Advertising Effectiveness
This article explores four common methods for incrementality measurement: Intent-to-Treat (ITT), Public Service Announcement (PSA) testing, Ghost Ads, and Ghost Bids.


What Is Incrementality Testing?
Incrementality testing is a method used to determine whether an ad campaign has a causal impact on key metrics such as revenue, conversions, or brand perception. The core idea is to measure the revenue generated from users who saw the ad and compare it to a baseline—what would have happened if they had never been exposed to the ad. The difference is the incremental impact of the ad.
Why Incrementality Testing Matters
Traditional attribution models often overestimate the effectiveness of ads because they fail to separate caused revenue from organic revenue—purchases that would have happened regardless of ad exposure.
For example, many users targeted by retargeting ads may have been planning to buy anyway. Research suggests that only about 10% of retargeting-driven revenue is truly incremental. If all revenue is attributed to ads, marketers risk significantly overestimating the impact of their campaigns.
The Ideal Way to Test Ad Effectiveness
A well-designed advertising experiment has two key elements:
A clearly defined target audience
Precise control over ad exposure
However, it's impossible for an advertising campaign to reach every user in your target audience. Whether a user sees a specific ad depends on various factors, including user behavior, bid competition between advertisers, and the availability of ad inventory across different placements.
Understanding Incrementality
At its core, incrementality measurement aims to answer a straightforward question: "Compared to showing no ads at all, did our advertising change user behavior?" But measuring this accurately requires careful experimental design.
Consider that users naturally have different purchasing behaviors. Some users (let's call them Type 1) have higher conversion rates, while others (Type 2) are less likely to convert. For a valid experiment, both your test and control groups must have the same proportion of these user types. Otherwise, you're essentially comparing apples to oranges.
Experimental Design
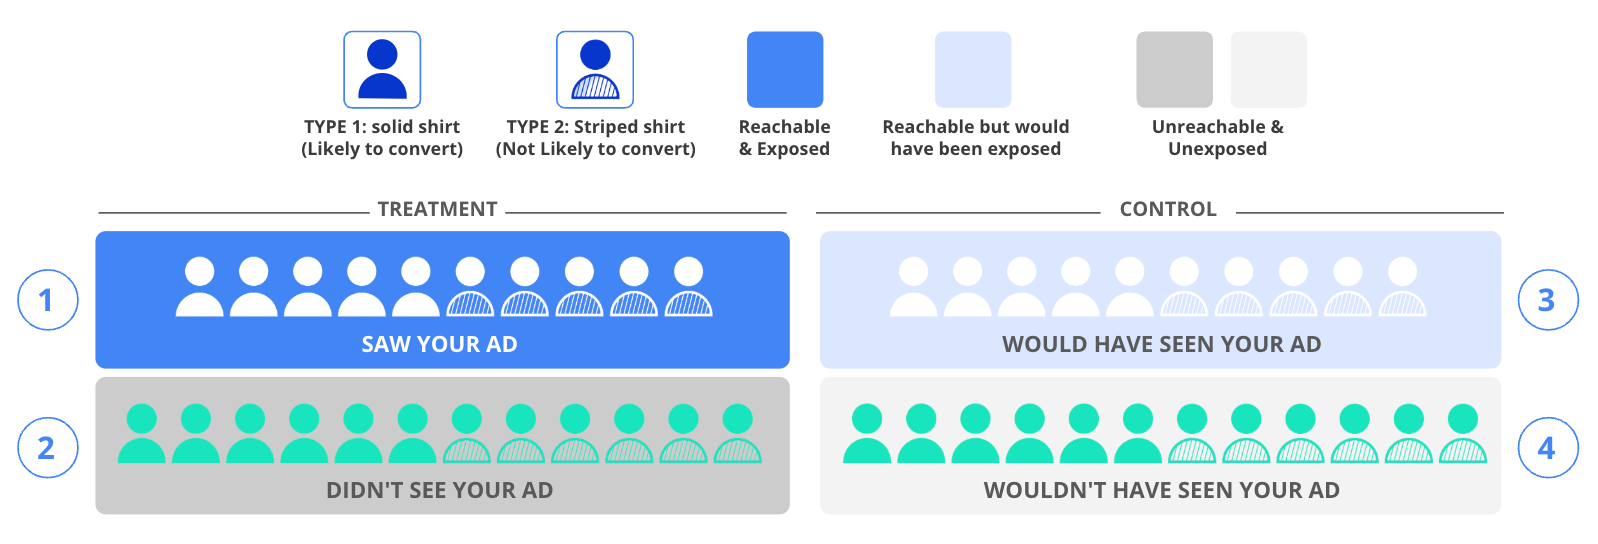
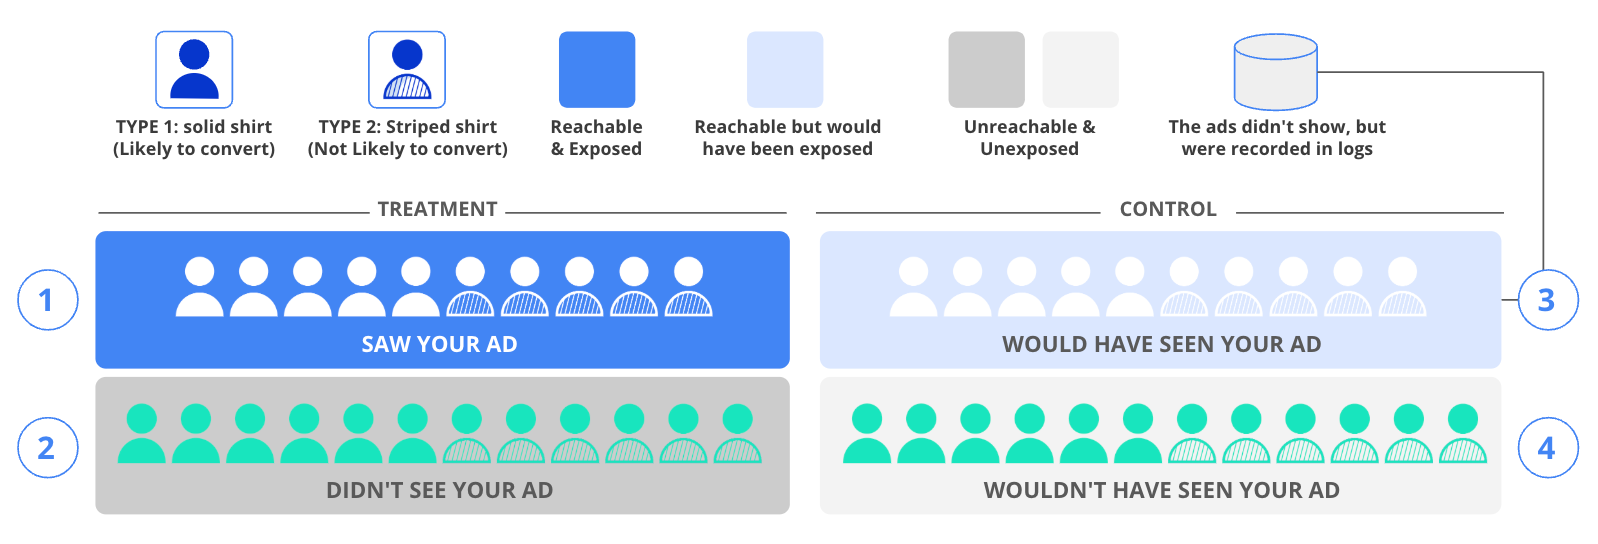
The scientific approach involves randomly dividing your target audience into two main groups: one that you'll attempt to show ads to, and another that won't see any ads at all. However, due to the nature of online advertising, you won't actually reach everyone in your target audience. This creates four distinct experimental groups:
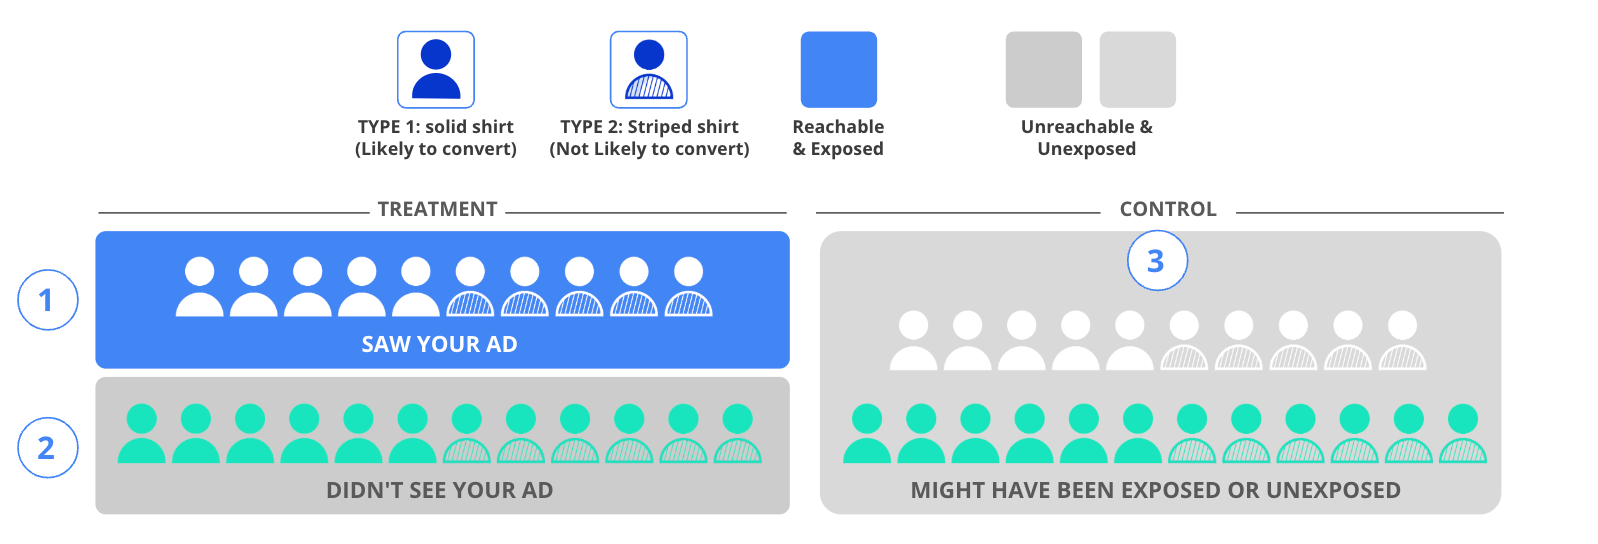
Treatment Group - Ad Exposed (Dark Blue): These are users who actually saw your ads. In our example, this includes 10 users - five each of Type 1 and Type 2 users.
Treatment Group - Not Reached (Dark Gray): These are users you wanted to reach but couldn't. This group has 12 users, evenly split between Type 1 and Type 2.
Control Group - Could Have Seen Ads (Light Blue): These users could have been shown ads, but we deliberately didn't show them any. This group mirrors the first group with 10 users, split evenly between types.
Control Group - Unreachable (Light Gray): These users couldn't be reached and didn't see any ads, matching the second group with 12 users split evenly between types.
Measuring Impact
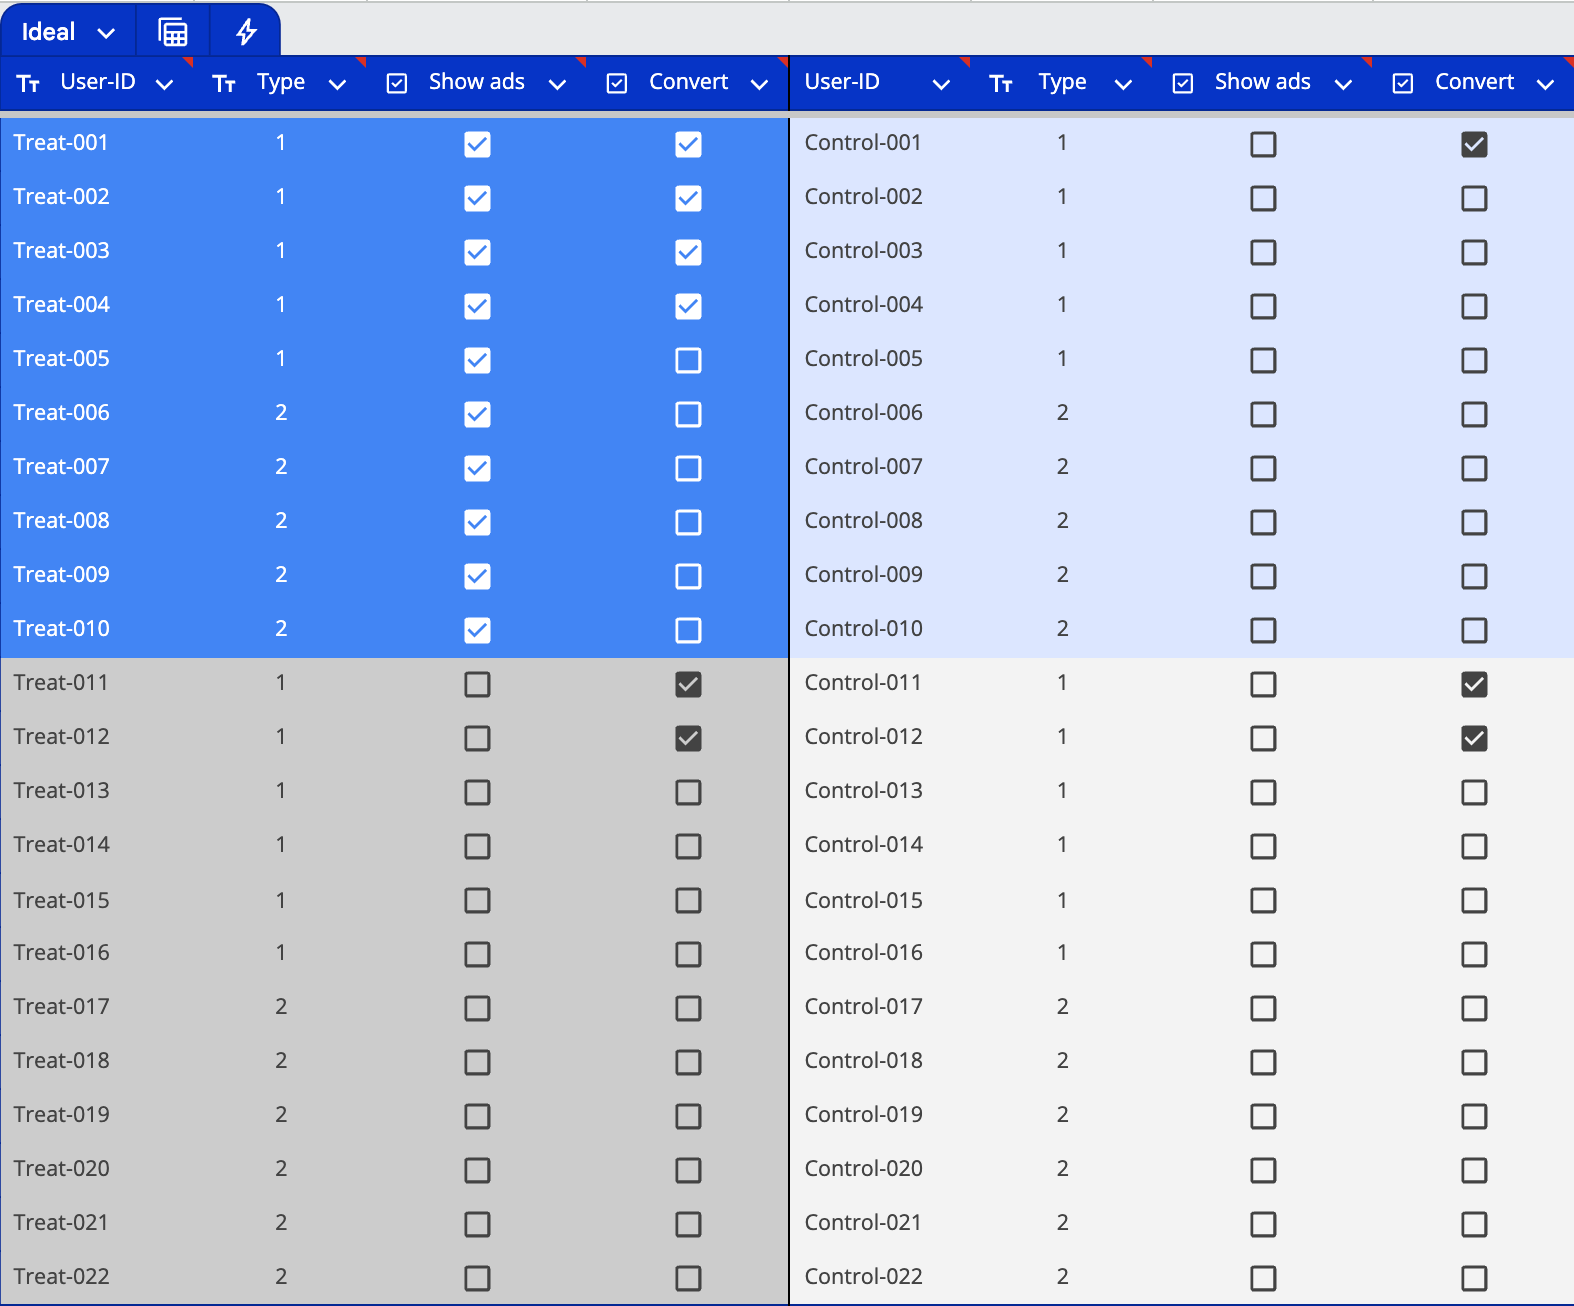
Modern advertising platforms allow us to track both ad exposures and subsequent conversions at the individual user level. In our example, the treatment group consisted of 22 total users, with 10 actually seeing the ads. Among those who saw the ads, four users eventually made a purchase.
This brings us back to our central question: How do we know whether these four conversions happened because of the ads, or would these users have purchased anyway? This is where the control group becomes crucial. It has the exact same user composition as the treatment group, with the only difference being that these users weren't shown any ads. In the control group, only one user completed a purchase without seeing any ads.
This controlled experimental setup allows us to compare behavior between users who actually saw ads (Group 1) and those who could have seen ads but didn't (Group 3), giving us a true measure of advertising's incremental impact.
Measuring the Business Impact
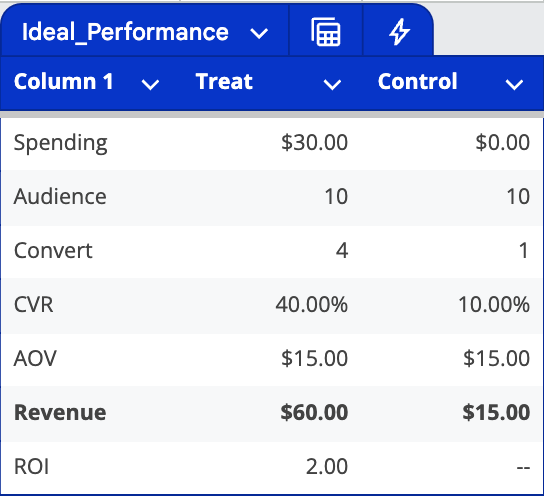
Let's break down the results by comparing the treatment and control groups. In our example, assume we spent $30 on ad delivery at an average order value (AOV) of $15. The treatment group generated $60 in revenue, while the control group generated $15. The difference of $45 represents the incremental value generated by our advertising - in other words, the true business impact of our ad spend.
Implementing Incrementality Testing in the Real World
Now that we understand the ideal experimental design, the next question is: How do we implement such incrementality tests in real-world conditions?
Two of the most common experimental designs for measuring incrementality are:
Public Service Announcement (PSA) Testing: Using public service announcements as the control group
Intent-to-Treat (ITT) Analysis: A statistical approach to analyzing experimental results
Both methods are essentially A/B tests designed to observe behavioral differences between groups. The main distinction lies in how they allocate users between treatment and control groups.
PSA (Public Service Announcement)
PSA testing is similar to placebo trials in clinical medicine. In this approach, the control group audience is shown unrelated ads, such as Red Cross campaigns or "Don't Drink and Drive" messages, instead of the advertiser's content. This is why it's called Public Service Announcement testing.
The Experimental Setup
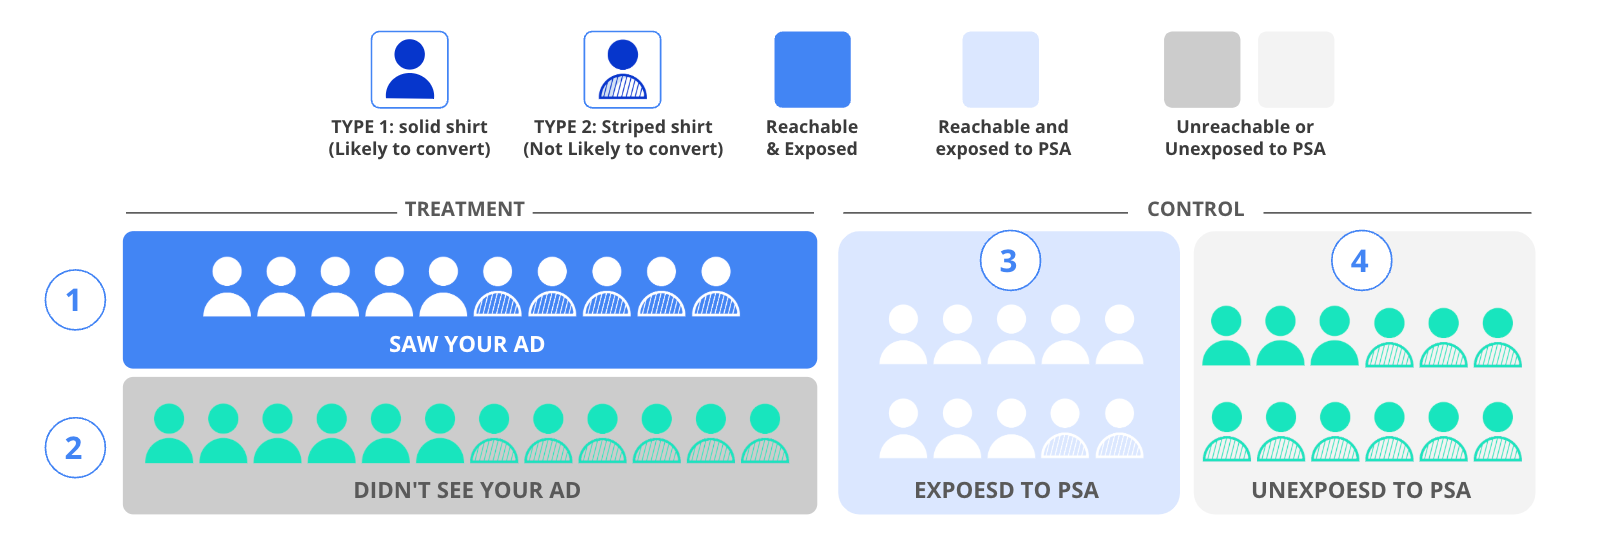
This method creates four distinct groups:
Treatment Group - Ad Exposed (Dark Blue): Users who saw the advertiser's ads (10 users: 5 Type 1, 5 Type 2)
Treatment Group - Not Reached (Dark Gray): Users targeted but not reached (12 users: 6 Type 1, 6 Type 2)
Control Group - PSA Exposed (Light Blue): Users who saw public service ads (10 users: 8 Type 1, 2 Type 2)
Control Group - Not Reached (Light Gray): Users who couldn't be reached with either ad type (12 users: 3 Type 1, 9 Type 2)
Key Challenges
The first major issue with PSA testing is audience composition mismatch between treatment and control groups. This discrepancy occurs due to ad platform optimization mechanisms, which we'll explore in detail later.
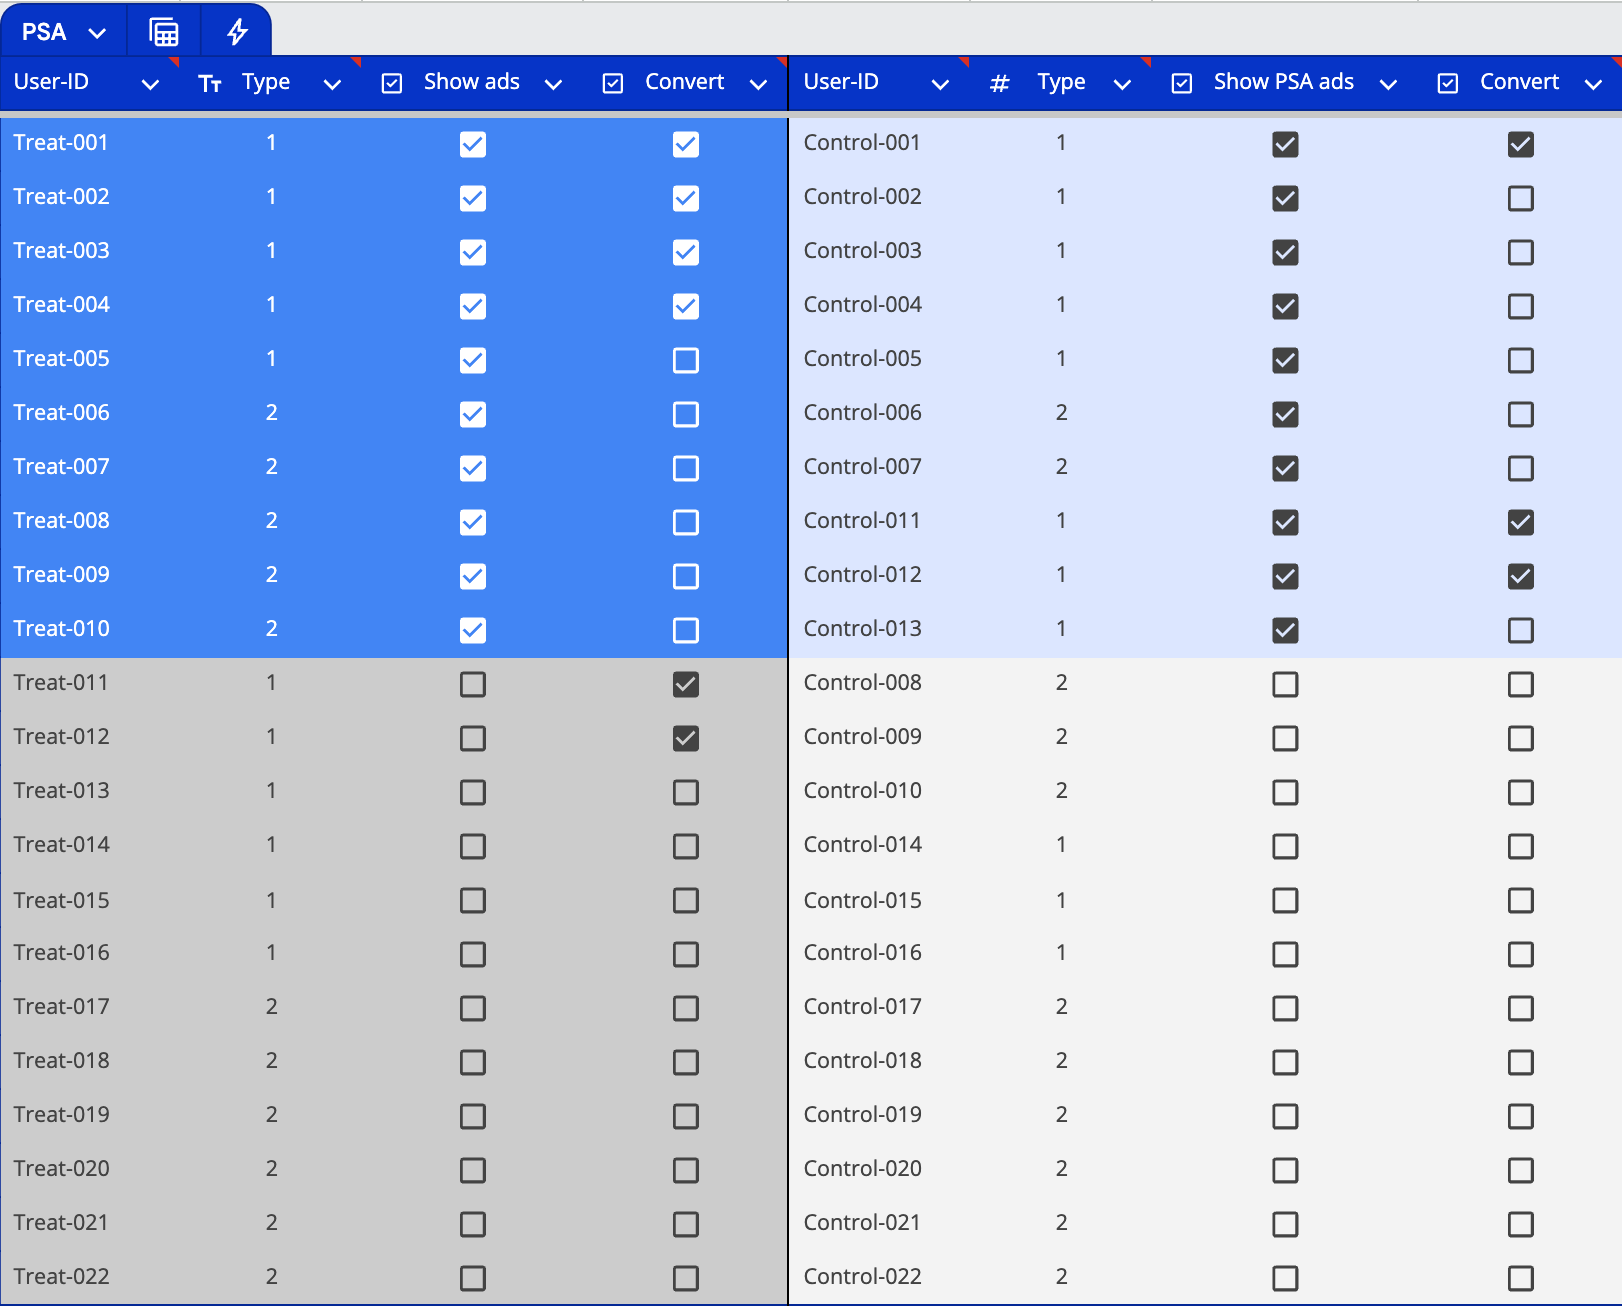
The crucial difference from our ideal experiment is that the control group (Light Blue) still sees ads - just PSAs instead of the advertiser's content. In our example, the single conversion in the control group (User Control-001) likely represents a user who was already interested in the product.
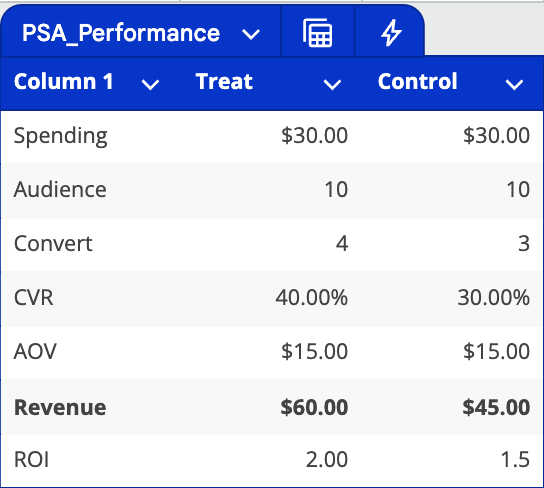
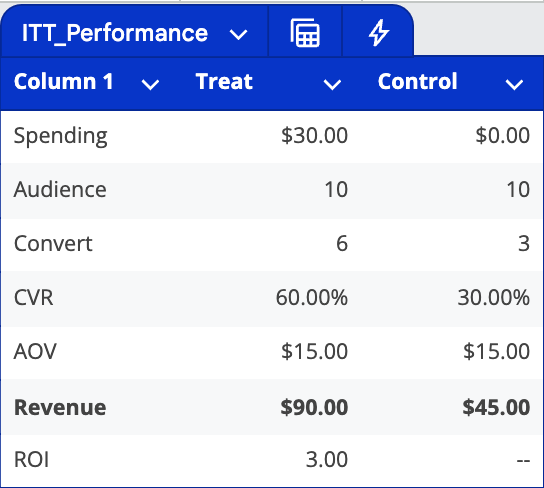
Let's examine the results. With a $30 ad spend in each group and a $15 cost per conversion, the treatment group generated $60 in revenue, while the control group generated $45 in revenue (from users who saw PSAs). The $15 difference represents the incremental impact of the advertising.
Critical Limitations
Several factors limit PSA testing's effectiveness:
Double Cost Structure: You're paying for both your ads and the PSAs shown to the control group.
Platform Optimization Issues: Modern advertising platforms typically optimize for CPC or CPA, which can skew PSA test results. For example, if a gaming app ad has higher click-through rates than a Red Cross ad, the platform will automatically show the gaming ad more frequently to users likely to click. This creates a fundamental mismatch - users who click on gaming ads might be very different from those who engage with PSAs.
The "Apples to Oranges" Problem: This optimization bias can lead to comparing fundamentally different audience segments, resulting in either overly optimistic or completely negative conclusions.
While PSA testing theoretically eliminates certain noise issues (which we'll discuss when we cover ITT testing), its high costs, accuracy problems, and inherent design flaws limit its viability as a long-term incrementality testing solution.
Intent-to-Treat (ITT) Testing
A seemingly straightforward approach to incrementality testing is to randomly split your target audience into two groups and show ads to only one of them. By comparing the behavior of all users in both groups (not just those who saw ads), we can measure advertising's causal impact. This method is called Intent-to-Treat (ITT) analysis.
How ITT Works
The method divides users into two main groups:
Treatment Group (Left Side): Combines both users who could be reached with ads (dark blue) and those who couldn't be reached (dark gray). This group totals 22 users, evenly split between Type 1 and Type 2 users (11 each).
Control Group (Right Side, Light Gray): These users receive no ads, regardless of their reachability. This group also has 22 users, with the same split between Type 1 and Type 2 users.
The Core Challenge
ITT's main weakness lies in its assumption about the dark gray section of the treatment group - users who were targeted but never reached. The method treats these unreached users as if they were exposed to ads, introducing significant noise into the data that can mask advertising's true incremental impact.
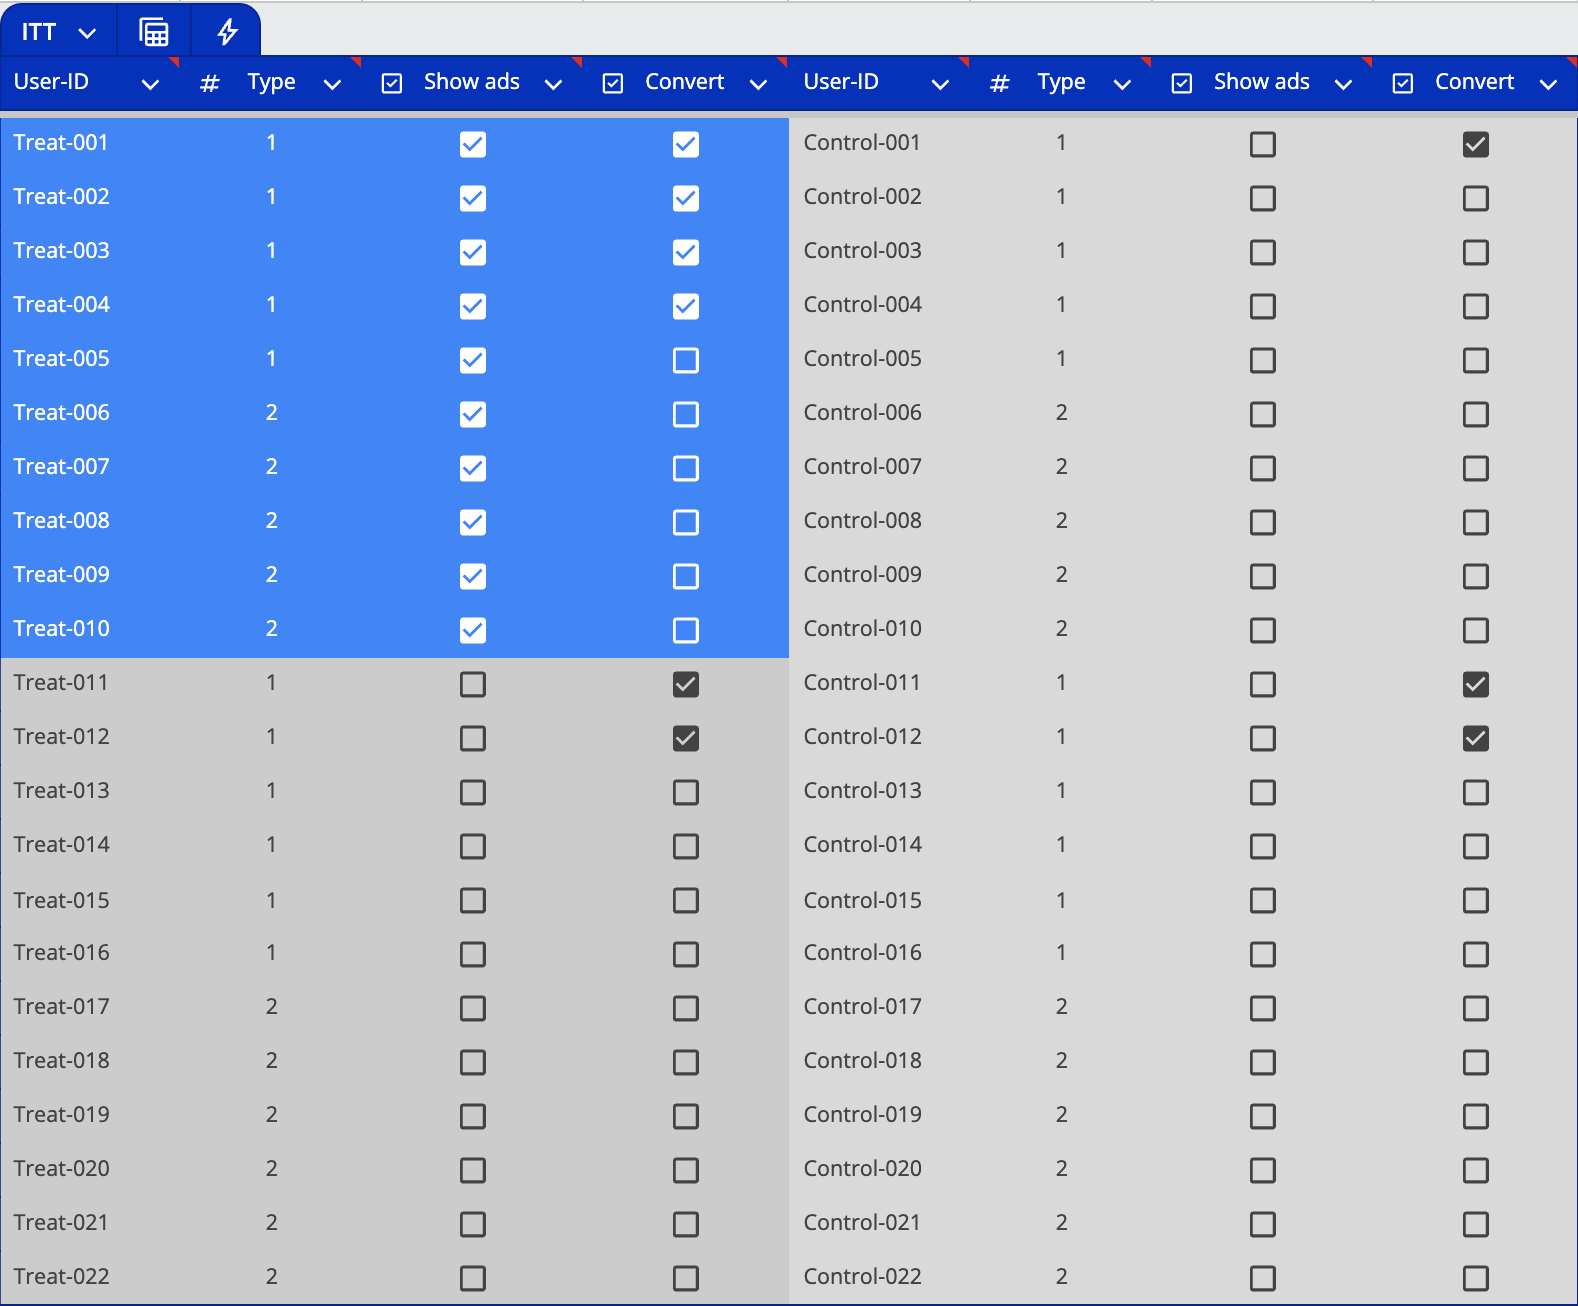
Let's look at a concrete example: In the treatment group of 22 users, there were 6 total conversions. However, only 4 of these converting users were actually reachable through advertising. The other 2 conversions came from users who would have converted anyway, despite never seeing an ad. Yet, ITT attributes all 6 conversions to advertising impact.
Real-World Implications
In practice, ITT remains the most widely used incrementality testing method due to its relatively simple implementation. It doesn't require complex integration with ad platforms, making it particularly attractive from an operational standpoint.
However, its fundamental flaw becomes more pronounced in real-world scenarios. Typically, only a small fraction of users in the treatment group actually see the ads. This limited reach can result from low availability of target audiences in supply channels or low win rates in programmatic bidding.
The larger this unreachable segment becomes, the more noise enters the data, significantly reducing the precision of measurement results.
Ghost Ads
In 2017, Boston University professor Garrett Johnson proposed the Ghost Ads methodology to address the limitations of both PSA and ITT testing. This innovative approach has transformed how we measure advertising effectiveness.
How Ghost Ads Work
Unlike traditional methods, Ghost Ads don't actually show alternative ads to the control group. Instead, the ad platform logs what would have happened if ads were shown, ensuring true comparability between:
Users who actually saw ads in the treatment group
Users who would have seen ads in the control group
This design solves two critical problems:
It eliminates the distortion issues common in PSA testing, even under CPC or CPA optimization models, since there's no competition between different ad types
It resolves ITT's noise problem by filtering out users who never had a chance to see ads, achieving up to 50 times more accurate results than ITT
The Bidding Process
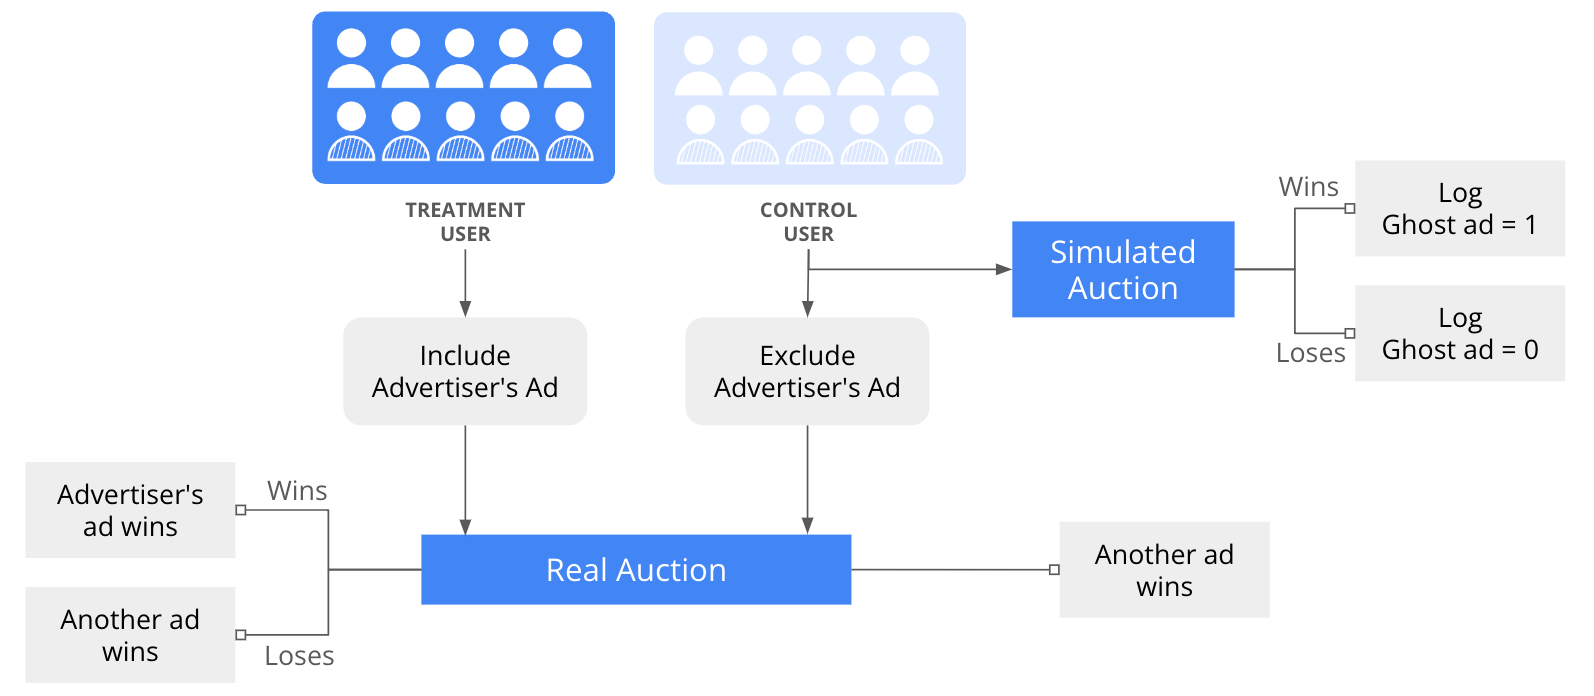
Ghost Ads operate through a sophisticated two-track auction system:
Treatment Group:
Normal ad auction process
Winners can be either the target ad or other advertisers' ads
Control Group:
Real Auction: Excludes the target ad, so users never see it
Simulated Auction: Runs simultaneously, including the target ad
Results are logged but don't affect what users actually see
Major platforms such as Google's Conversion Lift or Meta's incrementality optimization tools have already adopted Ghost Ads.
Ghost Ads work best when advertisers have control over ad distribution mechanisms. However, in environments with multiple bidders (like RTB), alternative approaches may be necessary.
Ghost Bids
Ghost Bids emerged as a refinement of the Ghost Ads methodology, specifically designed to address scenarios with multiple competing advertisers, particularly in retargeting campaigns. This innovation was necessary because in complex bidding environments, no single ad platform can fully control whether ads ultimately appear before users in the treatment group.
How Ghost Bids Works
The mechanism focuses on tracking:
All actual bids placed by advertisers in the treatment group
Potential bids that would have been placed in the control group
After the experiment concludes, researchers compare user behavior between:
Users who were bid on in the treatment group
Users who would have been bid on in the control group
Key Differences from Ghost Ads
While Ghost Bids shares most conceptual foundations with Ghost Ads, there's one crucial distinction:
Ghost Ads: Compares users who actually saw ads (treatment) vs. users who would have seen ads (control)
Ghost Bids: Compares users who were bid on (treatment) vs. users who would have been bid on (control)
Since Ghost Bids is based on auction participation rather than actual ad exposure, it introduces more noise into the data—participating in an auction doesn't guarantee ad visibility. As a result, Ghost Bids tends to have more noise and lower precision compared to Ghost Ads.
Conclusion
Marketers constantly grapple with a fundamental question: Are their substantial advertising investments truly driving business growth? This question becomes particularly pertinent in retargeting scenarios, where it's crucial to determine whether consumers make purchases because of ad exposure or pre-existing intent.
This growing need to distinguish between correlation and causation explains why incrementality measurement has become increasingly critical in recent years. This article has explored several common incrementality testing methods, examining their appropriate use cases, advantages, and limitations.
Each approach offers unique insights:
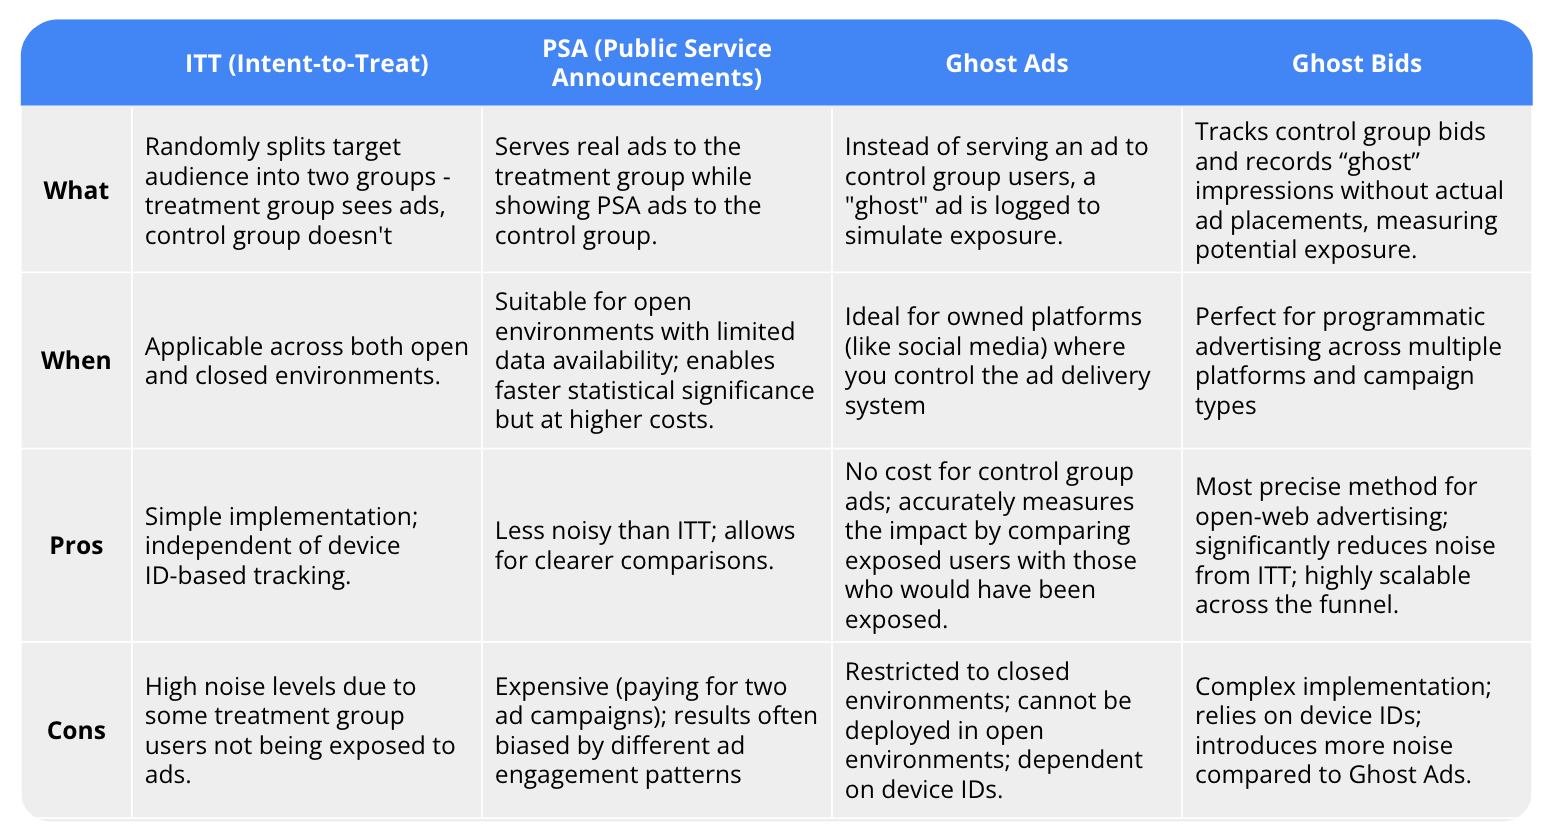
Understanding these methodologies and their trade-offs enables marketers to make more informed decisions about measuring their advertising's true impact on business outcomes.
Reference
Ghost Ads: Improving the Economics of Measuring Online Ad Effectiveness [LINK]
A Revolution in Measuring Ad Effectiveness: Knowing Who Would Have Been Exposed [LINK]
Incrementality Tests 101: Intent-to-treat, PSA and Ghost Bids [LINK]
Understanding incrementality: The key to measuring a campaign’s true impact [LINK]